Blog
See all posts31/01/2022 - Journal Club
Ion mobility meets Deep Learning.
Proteomics can be simply defined as the large-scale analysis of proteins – all the meaningful genome products – in a given sample [1,2]. Mass spectrometry (MS)-based proteomics is one of the most powerful approaches for identifying proteins from biological samples. Over years, there were many proteomics workflows generated by scientists in this field. The development of these workflows has revealed some difficulties that are being solved by the application of computational approaches. As we, PROTrEIN Early Stage Researchers, are currently working on the complexity of this field with the aid of training courses by the community, we hope to shed light on some relevant ideas.
In this month’s journal club, we would like to focus on specific terminology, “ion mobility” that is mostly related to our projects. With this paper, we did not only have a chance to mention this particular workflow and the required instruments of the ion mobility measurements, but it is also a good example of the implementation of a deep learning approach. We believe that this approach can be an inspiration in your respective projects.
P.S. There was a lot of thought that went into this selection. You can check out the process here.
To improve the accuracy of the LC-MS approach, computational calculation of collision cross-sections facilitates and allows the determination of ion mobilities and peptide drift times. But… what is ion mobility?
According to Wikipedia ion mobility spectrometry (IMS) is an analytical technique used to separate and identify ionized molecules in the gas phase based on their mobility in a carrier buffer gas. This mobility depends on the molecular shape so this technique introduces a new dimension of separation beyond the molecular mass used in mass spectrometry or the retention time used in chromatography. We can experience ionic mobility if we take two sheets of paper both of the same mass. We wrinkle one of them and make a ball out of it, and leave the other in its original state. Now we let them go from a certain height and we will see how according to their shape they move and advance at different speeds through the air until they touch the ground. They have different “paper mobility” or different drift times. The area of the paper subject to interaction with the air is also different, and it determines its “collisional cross section”. In the proteomics field, the prediction of peptide “collisional cross section” and drift times has practical application in peptide identification and may assist in the reduction of false discovery rates (FDRs).
In this paper, Meier et al. have recently integrated trapped ion mobility spectrometry (TIMS), with a high-resolution quadrupole Time Of Flight (TOF) mass analyzer to add an additional dimension for improving MS-based proteomics analysis [3]. In addition to this, they investigated a novel scan mode parallel accumulation – serial fragmentation (PASEF) and demonstrated that it increases MS/MS rates more than ten-fold without any loss in sensitivity. Accordingly, the combination of TIMS and PASEF should allow the acquisition of ion mobility values on a very large scale. By measuring the ion mobility coefficient (K0), they derived a collisional cross-section (CCS) for all measured peptides.
P.S. Quick way to reach the brief info about CCS, ion mobility and TIMS.
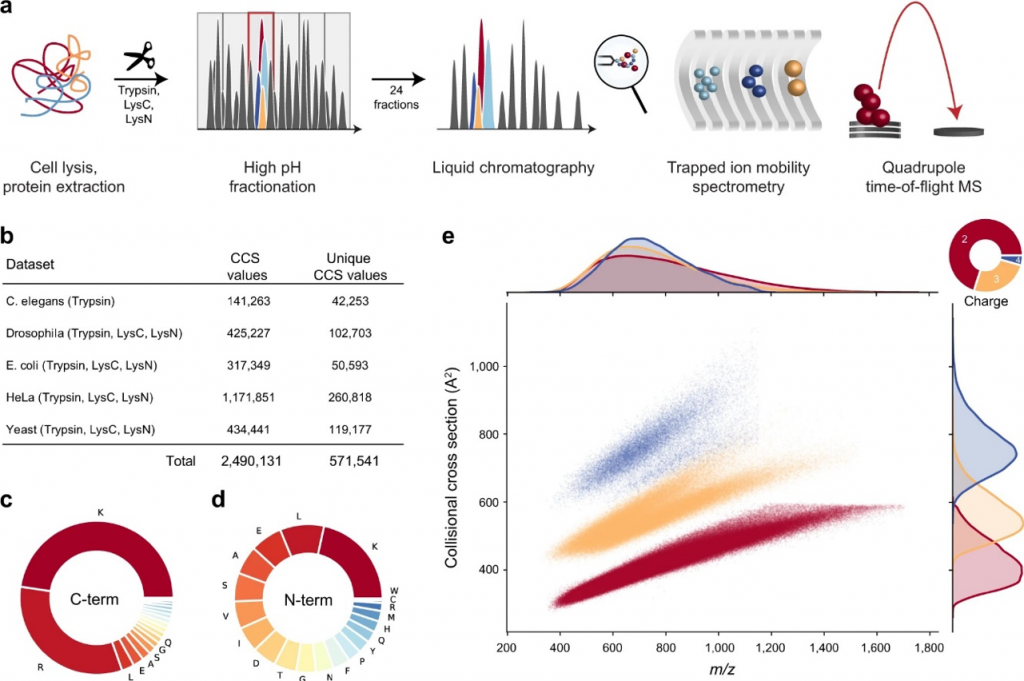
Before integrating ion mobility values to reduce the number of candidates in database searching, they characterized the precision and accuracy of the CCS values in the experimental dataset. They hypothesized that CCS values should be precise and reproducible as they are based on gas-phase interactions and defined electric fields, in contrast to chromatographic retention times. Thus, correlation coefficients for both retention time and CCS values were calculated using the highest number of shared peptides in the 168 LC-MS/MS runs among organisms. After that, they analyzed the peptide ions structure in the gas phase to find whether any effects of CCS values depend on linear protein sequence characteristics. As a result, non-polarity, the ratio of proline residues in the sequences, and the position of histidine are found as main factors to measure cross-sections.
As a result, information like charge states or proline-containing peptides could be extracted from the structures that had already defined ion-mobility values. Furthermore, the full determination of CCS values in the gas phase by using linear amino acid sequences proved that the CCS values should also be predictable with high accuracy.
It is clear from the above that there are certain factors such as positions of histidine and prolines ratios, which can be the main factors contributing to the CCS value. So, is it possible to determine the CCS value for peptide, just based on its linear sequence? Yes. But this is almost an impossible task considering the computational complexities involved. So, what’s the solution? You turn to deep learning, the goddess, anyone working with too much data, worships daily.
In this manuscript Florian and Mathias used a neural network to do this. The whole point is to throw a sequence into the machine and make it spit out the CCS value. Basically, when we say “PINAR”, the neural net yells back at us “11.1”. To achieve this “simple task”, we need to choose a neural network (NN) carefully. Usually, it’s an RNN (Recurrent NN) or a CNN (Convolutional NN).
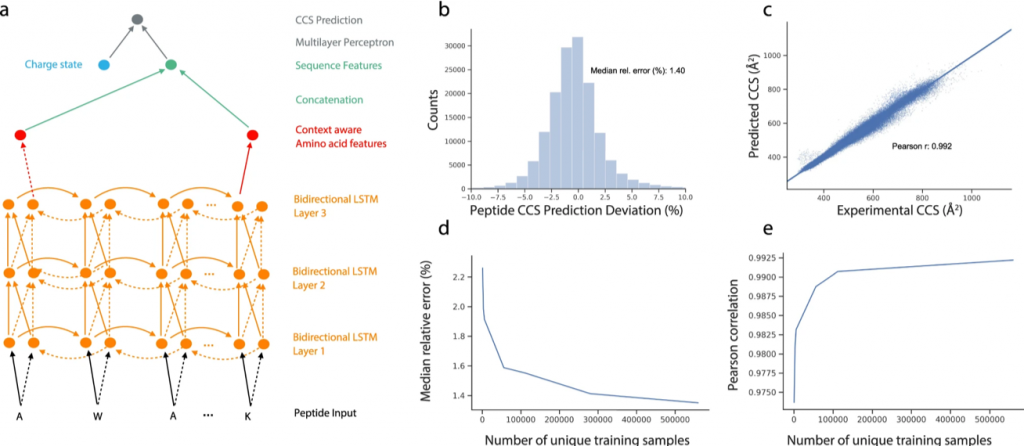
In this case, they used an RNN called LSTM. (Yeah. We know. Sounds like a drug from the 90s). These neural networks are good at handling long sequences (as opposed to basic vanilla RNN). They are commonly used in language processing, but they have other insane applications. Siri, Google Assistant, all of them use some version of it. The paper specifically uses a Bidirectional LSTM, which is good at capturing sequences that don’t care about directionality, here, peptide sequences. “RANIP” or “PINAR”, CCS value should be the same, right? This is in fact a common approach when dealing with peptide sequences. Prosit uses it. But recently, there was an attempt (Yulia et.al 2021) to use a 1D CNN which results in better accuracy than what this paper reports. Anyways, to be precise, the network architecture was a Bi-LSTM combined with a multi-layer perceptron. The charge state was given as an input to the perceptron. (Fig 2a).
So, did it work? After training from the experimental dataset for workflow mentioned above, they tested the neural net with a different dataset from ProteomeTools containing 155004 sequences, and guess what? The CCS value predictions were within a deviation (MdAD) of about 1.4%, (Fig 2b) which is great. But the deviation observed with experimental data (from ProteomeTools) was even lower at 0.6%. So, there is room for improvement. The 1D CNN approach we mentioned earlier, has recently reported deviations as low as 1.28%.
In conclusion, we think that this article is a delicate combination of both upstream and downstream approaches to proteomic analysis. By courtesy of this blog, we are familiar with TIMS-TOF PASEF techniques, terms of CCS and its derivation (ion mobility), and dependence of CCS values on amino acid characteristics, as well as neural network applications on proteomics.
If you have any questions or want to learn more about the main study, you would like to look at the “Q/A part” which you can reach here.
References
- Aebersold R, Mann M. Mass spectrometry-based proteomics. Nature. 2003;422:198–207.
- Pandey A, Mann M. Proteomics to study genes and genomes. Nature. 2000;405:837–846.
- Meier F, Mann M. Deep learning the collisional cross-section of the peptide universe from million experimental values. Nature Comm. doi.org/10.1038/s41467-021-21352-8.
- Samukhina, Y. V., Matyushin, D. D., Grinevich, O. I., & Buryak, A. K. (2021). A Deep Convolutional Neural Network for Prediction of Peptide Collision Cross Sections in Ion Mobility Spectrometry. Biomolecules, 11(12), 1904. https://doi.org/10.3390/biom11121904

Categories
Latest posts

08/05/2024 - Journal Club
Cross-Border Collaboration: Enhancing Peptide Identification with MS2Rescore and MS Amanda

08/09/2023 - Journal Club
Exploring Cellular Complexity: Unveiling Single-Cell Proteomics

23/08/2023 - Journal Club
Modeling Lower-Order Statistics to Enable Decoy-Free FDR Estimation in Proteomics