Blog
See all posts26/06/2022 - Journal Club
“Cross-Linking Mass Spectrometry: A sneak peak into its world!! ”
It has been a while since our official PROTrEIN launch. We’ve had monthly ESR meetings during this time, where the majority of us have been able to discuss more details about our projects and present them to the group. Several ESRs are working on developing new tools and data analysis pipelines to improve cross linking mass spectrometer data analysis. It is worthy to note that these ESRs are supervised by great supervisors who’ve already made significant contributions to the field of cross linking.
For this month’s journal club, we therefore chose the review paper «Cross-linking mass spectrometry: methods and applications in structural, molecular, and systems biology» by F. O’Reilly and J. Rappsilber[1].
Cross-linking mass spectrometry (CLMS) has emerged as a useful technique in structural biology research, complementing traditional approaches such as x-ray crystallography and electron microscopy. CLMS allows researchers to investigate proteins in solution, capturing them in a dynamic state that is closer to physiological settings. CLMS also allows for the analysis of heterogeneous samples containing compounds in low quantities, showcasing the benefits of CLMS.
Overview of CLMS:
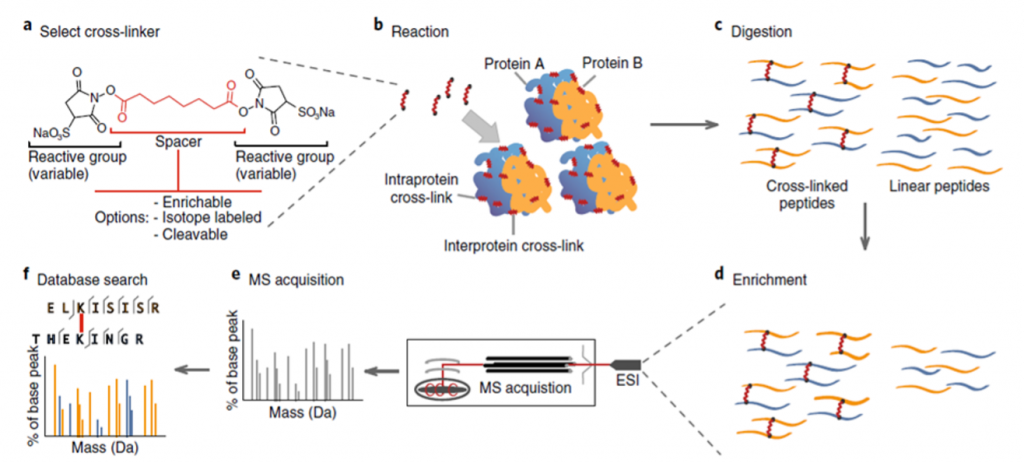
In the cross-linking reaction, covalent bonds are formed between the reactive groups of the cross-linker and surface residues of proteins, peptides and/or nucleic acids (DNA and RNA).
This way, residues that are within a certain reach of each other can be linked, thereby providing information about tertiary structure as well as interactions between protein complexes and/or nucleic acids.
Chemical cross-linkers are molecules with a spacer region flanked by reactive end groups that are extremely specific, while others are not. The chemical properties of the reactive groups and the length of the spacer region establish the limits of a cross-linker and therefore can be designed to accommodate different CLMS workflows. CLMS is not limited to studying the structure and interactions between proteins but can also be performed to gain knowledge about interactions between proteins and nucleic acids, however this blog post focuses specifically on the application and workflows involving proteins and peptides.
The general CLMS workflow is shown in Figure 1.
CLMS Applications:
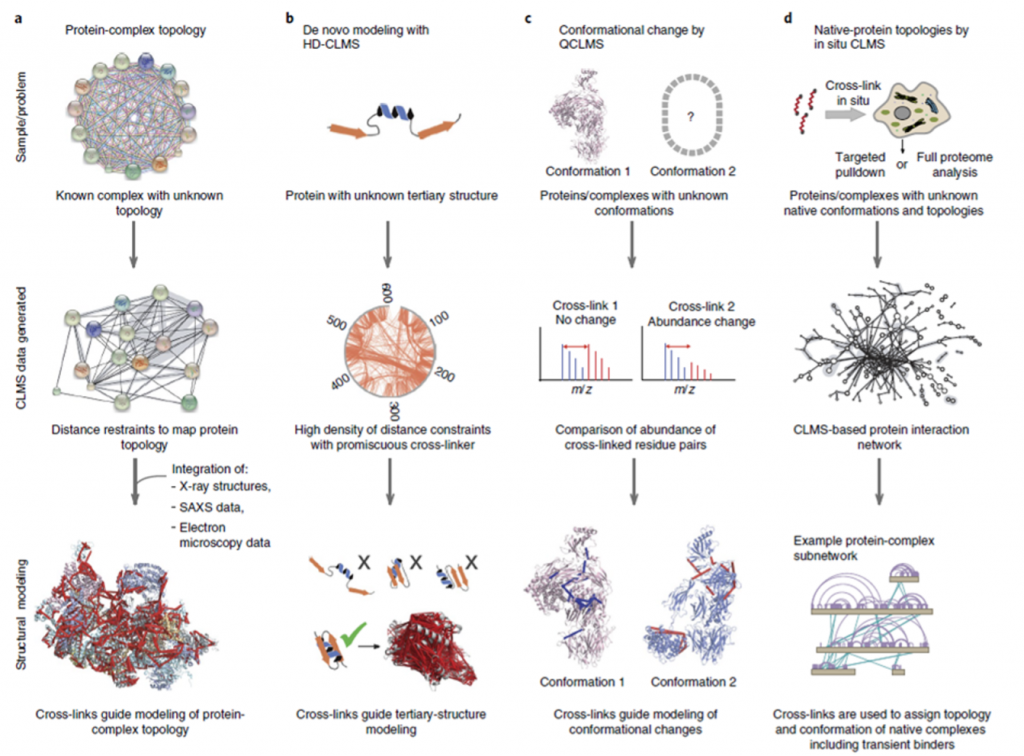
The review paper we are discussing focuses on four overall applications of CLMS in protein studies, as illustrated in Figure 2, however CLMS has many more applications.
Modeling of protein complex topology is one of the most common uses of CLMS to investigate how proteins are ordered with respect to one another as they form complexes, a process known as protein complex topology. In circumstances where the complex topology is unknown, information concerning distance limits between surface residues of proteins that are known to be complex can be used with other structural research tools to aid modeling of the complex topology.
Tertiary protein structure modeling can benefit from High Density (HD) CLMS. HD-CLMS data is acquired by using a cross-linker that is semi specific; one of the reactive groups only binds to specific residues, whereas the other group has no binding restrictions. This type of cross-linker will create a highly dense mapping of distance restraints between residues on the protein surface. Using this information can help exclude certain arrangements of the secondary structure elements of the proteins, thereby supporting modeling of the tertiary structure. Using a semi-specific cross-linker makes the data highly complex due to the large number of crosslinks formed in the reaction.
Quantitative CLMS based comparative studies can be utilized to study proteins in different conformations. The relative abundance of distinct cross-links generated in each sample can be determined by adding isotopically labeled cross-linkers to samples from different experimental conditions. This information can help detect whether a protein is predominantly in one conformation or another, depending on the conditions of the experiment. These comparative analyses work best for proteins that go through conformational changes that strongly affect the structure since it affects the amount of cross-links that can be produced.
Proteome-wide CLMS studies focus on studying protein-protein interactions (PPIs) in large scale However, due to the enormous number of possible cross-links that might form between peptides, the data from these tests is exceedingly complex, posing some issues. Proteome-wide PPI research can be done in a variety of ways. Targeted pulldown procedures, in which natural protein complexes are identified and examined; cell lysate analysis, in which PPIs in the soluble proteome are explored; and in situ studies of complete cells or organelles are just a few examples.
CLMS workflows:
Although the overwhelming number of workflows available can be perplexing for newcomers in this field the development of standardized reagents and workflows has significantly boosted the simplicity to use CLMS. For the detection of cross-linked peptides, a number of software solutions are now available. The typical method for gauging confidence, regardless of the search program employed, is to utilize a target-decoy strategy to estimate the false discovery rate (FDR).
Emerging reporting standards and data-visualization tools are facilitating this technique’s accessibility, which are discussed below briefly:
❖ Reporting standards in CLMS: Because this field hasn’t publicly agreed on minimal reporting standards, it’s difficult to evaluate papers and reuse data. “mzIdentML” (http://www.psidev.info/mzidentml/) is an XML-based reporting standard for proteomics data developed by the Human Proteomics Standards Initiative (HUPO-PSI), which includes CLMS.
Raw spectrometric data should be deposited in certain public repository after publication.There is a need for clarification when reporting results when the word ‘cross-link’ is used interchangeably for peptide spectral matching (PSMs), peptide pairings, and residue pairs, because the defined FDR at the PSM or peptide level results in an unknown and typically much larger FDR at the level of residue pair.
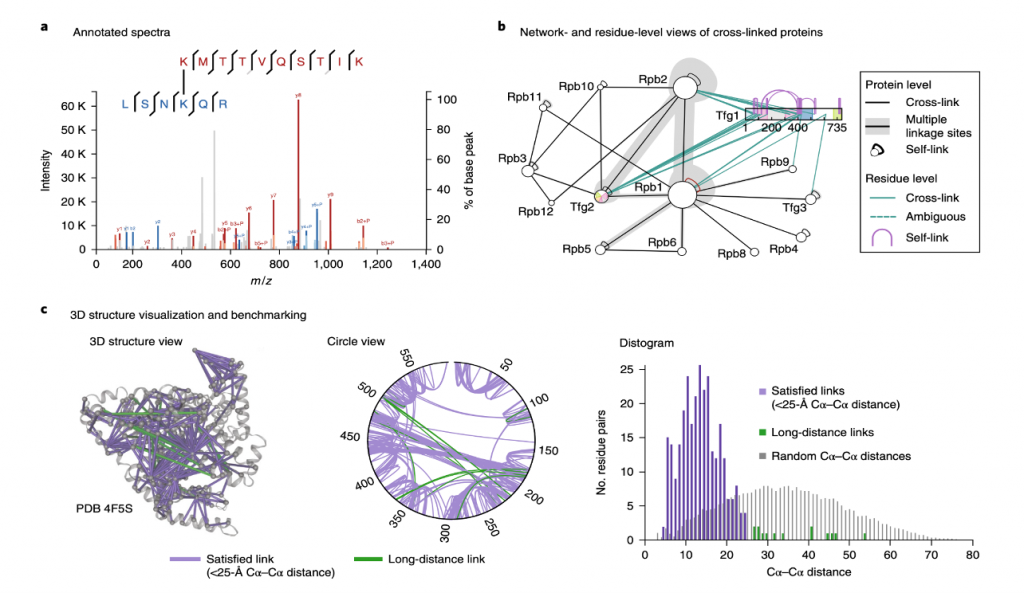
❖ Data Visualization and interpretation: Software for visualizing discovered cross-links and the mass spectra that lead to their identification has been developed by numerous laboratories to make CLMS data accessible. Many levels of information is provided by cross-linking studies including:
A. Residue–Residue links
B. 3D structural information
C. Protein–Protein interactions
Figure 3 shows that their combination is one-of-a-kind, necessitating custom visualization.
“Notably, the cross-linker spacer’s chemistry can be tweaked, enabling data analysis simpler and boosting confidence in the cross-links found. As a result, before starting a study, it’s important to think about the best cross-linker to be used in conjunction with the analysis pipeline.”
Now we’ll look at some of the most prominent methods for analyzing CLMS.
Universal approach: Most comprehensive method, does not necessitate changing the cross-linker spacer in order to perform downstream analysis, commonly employed in conjunction with commercial cross-linkers, and effective for cross-linkers that can’t be modified in the spacer region , like photo amino acids. Isotope labeling is not crucial for identification and can be employed in quantitative or comparative studies. Using modern mass spectrometers, MS/MS spectra can be recorded at high resolution, which reduces the chance of getting false positive hits in the identification. StavroX[2], Xlink-Identifier[3], and Xcomb[4] generate a database of potentially cross-linked peptide pairs, but as the number of proteins grows, their computational time increases. Modification search combined with experimental heuristics that computationally enrich possible cross-linked peptides, save search time before scoring the spectra in Xi[5], Plink[6], XLSearch[7], Protein Prospector82[8], ECL2[9] , and Kojak[10].
Labeled cross-linker approach: Samples are treated with a mix of a heavy-isotope-labeled cross-linker and its unlabeled equivalent. Cross-linked peptides can then be identified in the MS1 spectra by searching for doublet peaks that are displaced by the mass of the heavy isotopes. MS2 spectra of the ‘light’ (unlabelled cross-linker) and ‘heavy’ (isotopically labeled cross-linker) precursors can reveal which fragment ions can contain the cross-linker, for confident cross-link identification, Hekate[11], StavroX, and the widely used xQuest[12] are just a few examples of search tools that use this approach. Talking about its positive side, this method streamlines data-analysis operations and can even be useful where high-accuracy mass spectrometers are not accessible, but it also increases the complexity of the MS1 spectrum space, potentially lowering recognition rates. Furthermore, requiring both heavy and light precursors for fragmentation can cause problems in complex samples.
MS2-cleavable cross-linker approach: utilizes cross-linkers that are cleavable during MS2 fragmentation, resulting in two peptides per MS2 spectrum that can be observed as unique cross-link-specific fragment ions. As cross-linked peptides are vast and branched, their fragmentation spectra are complex and uneven. The vast number of potential peptide combinations, combined with the frequently poor fragmentation of one of the cross-linked peptides, can make identifying the two peptides challenging, but this can be made easier by separating the two peptides in the mass spectrometer. This technique employs longer duty cycles than MS2-only approaches and requires additionally to execute MS3. Acquisition approaches for these cross-linkers have been designed by several laboratories along with their respective search software, such as ICC-CLASS[13], MeroX[14], X-links/Blinks[15,16] and XlinkX2.0[17,18]. After the review was published in 2018, an additional cross-linking search engine, MS Annika[19] was published in 2021
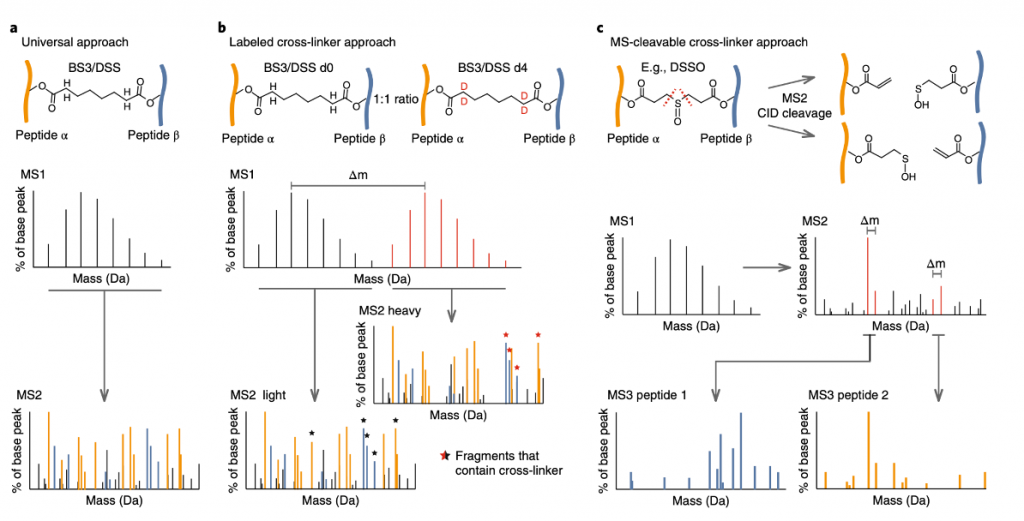
Figure 4 CLMS data acquisition and analysis workflows.(a) The ‘universal approach’ uses cross-linkers with simple spacers (b) Labeled cross-linker approach using isotopically labeled cross-linkers. (c) Cross-linker approach that uses cleavable cross-linkers in MS2 fragmentation.
Conclusion:
We hope you now understand why CLMS is such a powerful tool for examining protein interactions and topology. CLMS is a blooming field, with new processes and cross-linkers being developed as well as data analysis. Advances in data acquisition should be accompanied by improvements in data analysis. PROTrEIN ESRs, as well as other community members, are working on new tools and analysis pipelines to empower researchers to make new discoveries.
What do you anticipate CLMS will provide next?
References:
- O’Reilly, F.J., Rappsilber, J. Cross-linking mass spectrometry: methods and applications in structural, molecular and systems biology. Nat Struct Mol Biol 25, 1000–1008 (2018). https://doi.org/10.1038/s41594-018-0147-0
- Götze M, Pettelkau J, Schaks S, Bosse K, Ihling CH, Krauth F, Fritzsche R, Kühn U, Sinz A. StavroX–a software for analyzing crosslinked products in protein interaction studies. J Am Soc Mass Spectrom. 2012 Jan;23(1):76-87. doi: 10.1007/s13361-011-0261-2. Epub 2011 Oct 25. PMID: 22038510.
- Du X, Chowdhury SM, Manes NP, Wu S, Mayer MU, Adkins JN, Anderson GA, Smith RD. Xlink-identifier: an automated data analysis platform for confident identifications of chemically cross-linked peptides using tandem mass spectrometry. J Proteome Res. 2011 Mar 4;10(3):923-31. doi: 10.1021/pr100848a. Epub 2011 Feb 16. PMID: 21175198; PMCID: PMC3048902.
- Panchaud A, Singh P, Shaffer SA, Goodlett DR. xComb: a cross-linked peptide database approach to protein-protein interaction analysis. J Proteome Res. 2010 May 7;9(5):2508-15. doi: 10.1021/pr9011816. PMID: 20302351; PMCID: PMC2884221.
- Giese SH, Fischer L, Rappsilber J. A Study into the Collision-induced Dissociation (CID) Behavior of Cross-Linked Peptides. Mol Cell Proteomics. 2016 Mar;15(3):1094-104. doi: 10.1074/mcp.M115.049296. Epub 2015 Dec 30. PMID: 26719564; PMCID: PMC4813691.
- Yang B, Wu YJ, Zhu M, Fan SB, Lin J, Zhang K, Li S, Chi H, Li YX, Chen HF, Luo SK, Ding YH, Wang LH, Hao Z, Xiu LY, Chen S, Ye K, He SM, Dong MQ. Identification of cross-linked peptides from complex samples. Nat Methods. 2012 Sep;9(9):904-6. doi: 10.1038/nmeth.2099. Epub 2012 Jul 8. PMID: 22772728.
- Ji C, Li S, Reilly JP, Radivojac P, Tang H. XLSearch: a Probabilistic Database Search Algorithm for Identifying Cross-Linked Peptides. J Proteome Res. 2016 Jun 3;15(6):1830-41. doi: 10.1021/acs.jproteome.6b00004. Epub 2016 May 6. PMID: 27068484; PMCID: PMC5770149.
- Trnka MJ, Baker PR, Robinson PJ, Burlingame AL, Chalkley RJ. Matching cross-linked peptide spectra: only as good as the worse identification. Mol Cell Proteomics. 2014 Feb;13(2):420-34. doi: 10.1074/mcp.M113.034009. Epub 2013 Dec 12. PMID: 24335475; PMCID: PMC3916644.
- Yu F, Li N, Yu W. Exhaustively Identifying Cross-Linked Peptides with a Linear Computational Complexity. J Proteome Res. 2017 Oct 6;16(10):3942-3952. doi: 10.1021/acs.jproteome.7b00338. Epub 2017 Sep 1. PMID: 28825304.
- Hoopmann MR, Zelter A, Johnson RS, Riffle M, MacCoss MJ, Davis TN, Moritz RL. Kojak: efficient analysis of chemically cross-linked protein complexes. J Proteome Res. 2015 May 1;14(5):2190-8. doi: 10.1021/pr501321h. Epub 2015 Apr 15. PMID: 25812159; PMCID: PMC4428575.
- Holding AN, Lamers MH, Stephens E, Skehel JM. Hekate: software suite for the mass spectrometric analysis and three-dimensional visualization of cross-linked protein samples. J Proteome Res. 2013 Dec 6;12(12):5923-33. doi: 10.1021/pr4003867. Epub 2013 Oct 4. PMID: 24010795; PMCID: PMC3859183.
- Rinner O, Seebacher J, Walzthoeni T, Mueller LN, Beck M, Schmidt A, Mueller M, Aebersold R. Identification of cross-linked peptides from large sequence databases. Nat Methods. 2008 Apr;5(4):315-8. doi: 10.1038/nmeth.1192. Epub 2008 Mar 9. Erratum in: Nat Methods. 2008 Aug;5(8):748. PMID: 18327264; PMCID: PMC2719781.
- Petrotchenko, E.V., Borchers, C.H. ICC-CLASS: isotopically-coded cleavable crosslinking analysis software suite. BMC Bioinformatics 11, 64 (2010). https://doi.org/10.1186/1471-2105-11-64
- Götze M, Pettelkau J, Fritzsche R, Ihling CH, Schäfer M, Sinz A. Automated assignment of MS/MS cleavable cross-links in protein 3D-structure analysis. J Am Soc Mass Spectrom. 2015 Jan;26(1):83-97. doi: 10.1007/s13361-014-1001-1. Epub 2014 Sep 27. PMID: 25261217.
- Hoopmann MR, Weisbrod CR, Bruce JE. Improved strategies for rapid identification of chemically cross-linked peptides using protein interaction reporter technology. J Proteome Res. 2010 Dec 3;9(12):6323-33. doi: 10.1021/pr100572u. Epub 2010 Nov 10. PMID: 20886857; PMCID: PMC3018735.
- Anderson GA, Tolic N, Tang X, Zheng C, Bruce JE. Informatics strategies for large-scale novel cross-linking analysis. J Proteome Res. 2007 Sep;6(9):3412-21. doi: 10.1021/pr070035z. Epub 2007 Aug 3. PMID: 17676784; PMCID: PMC2475505.
- Liu F, Lössl P, Scheltema R, Viner R, Heck AJR. Optimized fragmentation schemes and data analysis strategies for proteome-wide cross-link identification. Nat Commun. 2017 May 19;8:15473. doi: 10.1038/ncomms15473. PMID: 28524877; PMCID: PMC5454533.
- Liu F, Rijkers DT, Post H, Heck AJ. Proteome-wide profiling of protein assemblies by cross-linking mass spectrometry. Nat Methods. 2015 Dec;12(12):1179-84. doi: 10.1038/nmeth.3603. Epub 2015 Sep 28. PMID: 26414014.
- Pirklbauer GJ, Stieger CE, Matzinger M, Winkler S, Mechtler K, Dorfer V. MS Annika: A New Cross-Linking Search Engine. J Proteome Res. 2021 May 7;20(5):2560-2569. doi: 10.1021/acs.jproteome.0c01000. Epub 2021 Apr 14. PMID: 33852321; PMCID: PMC8155564.
Source of gallery picture of this blog-post: Juan Gaertner/Science Photo Library/Getty Images

Categories
Latest posts

08/05/2024 - Journal Club
Cross-Border Collaboration: Enhancing Peptide Identification with MS2Rescore and MS Amanda

08/09/2023 - Journal Club
Exploring Cellular Complexity: Unveiling Single-Cell Proteomics

23/08/2023 - Journal Club
Modeling Lower-Order Statistics to Enable Decoy-Free FDR Estimation in Proteomics