Blog
See all posts14/10/2021 - Journal Club
How can proteomics data become more reproducible?
In the first PROTrEIN Summer School we were introduced to proteomics. We learned about many different aspects of proteomics, including some of the challenges associated with proteomics experiments. However, as this was only an introductory course, everything concerning proteomics could not be highlighted. We therefore saw this first journal club as an opportunity to highlight data reproducibility, which is important not only for proteomics experiments but also in all other areas of research. Research reproducibility is indeed one of the major science problems, and it becomes even more significant when scientists are dealing with large quantities of noisy data. This paper focuses specifically on the reproducibility of DIA MS data in large-scale proteomics studies.
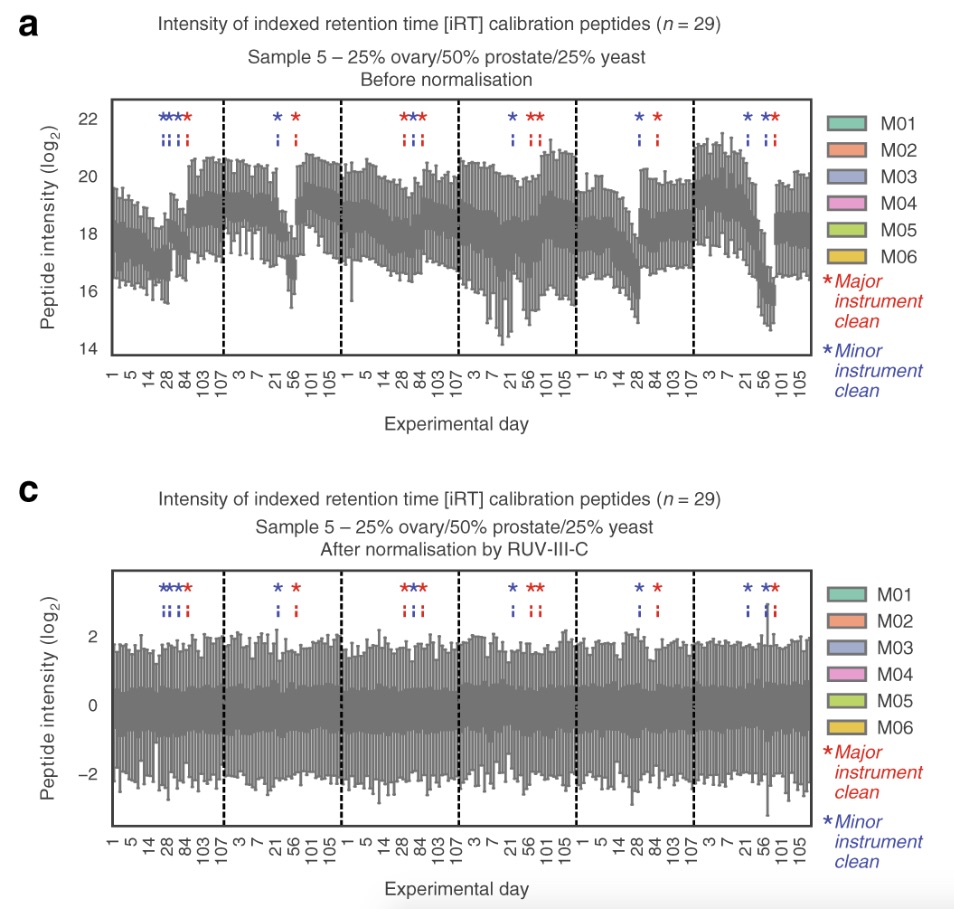
The researchers performed 1560 DIA-MS runs on six different instruments (of the same type) over the course of four months, with one major instrument cleaning after three months. The purpose of this was to investigate the reproducibility of the data over the extensive time period. They found that the data became less reproducible over time, but that the reproducibility was ‘restored’ after the cleaning. Using their novel normalization method, the researchers were able to mitigate the unwanted variation of the data that arose due to the decrease in instrument performance over time. Furthermore, they demonstrated that using technical replicates of samples allows for data imputation for a more complete dataset, hence making the data more reproducible.
We think this paper is relevant for us as computational proteomics researchers, because even though we are not performing experiments in the laboratory, we must still be aware of data reproducibility and what measures can be taken to improve it, both during and after data acquisition. As large-scale proteomics research becomes increasingly common, the strategies mitigating instrumental and other non-biological variation grow in importance.
Reference: Nat Commun. 2020 Jul 30;11(1):3793. doi: 10.1038/s41467-020-17641-3.

Categories
Latest posts

08/05/2024 - Journal Club
Cross-Border Collaboration: Enhancing Peptide Identification with MS2Rescore and MS Amanda

08/09/2023 - Journal Club
Exploring Cellular Complexity: Unveiling Single-Cell Proteomics

23/08/2023 - Journal Club
Modeling Lower-Order Statistics to Enable Decoy-Free FDR Estimation in Proteomics